Your website isn't just a digital brochure. It's a revenue engine — and right now, most engines are running on 2 out of 6 cylinders.
This course covers the three pillars that separate websites that make money from websites that lose it: Visibility (can AI find you?), Retention (do visitors stay?), and Conversion (do they take action?).
17 chapters. About 15 minutes. Backed by real stats, not opinions.
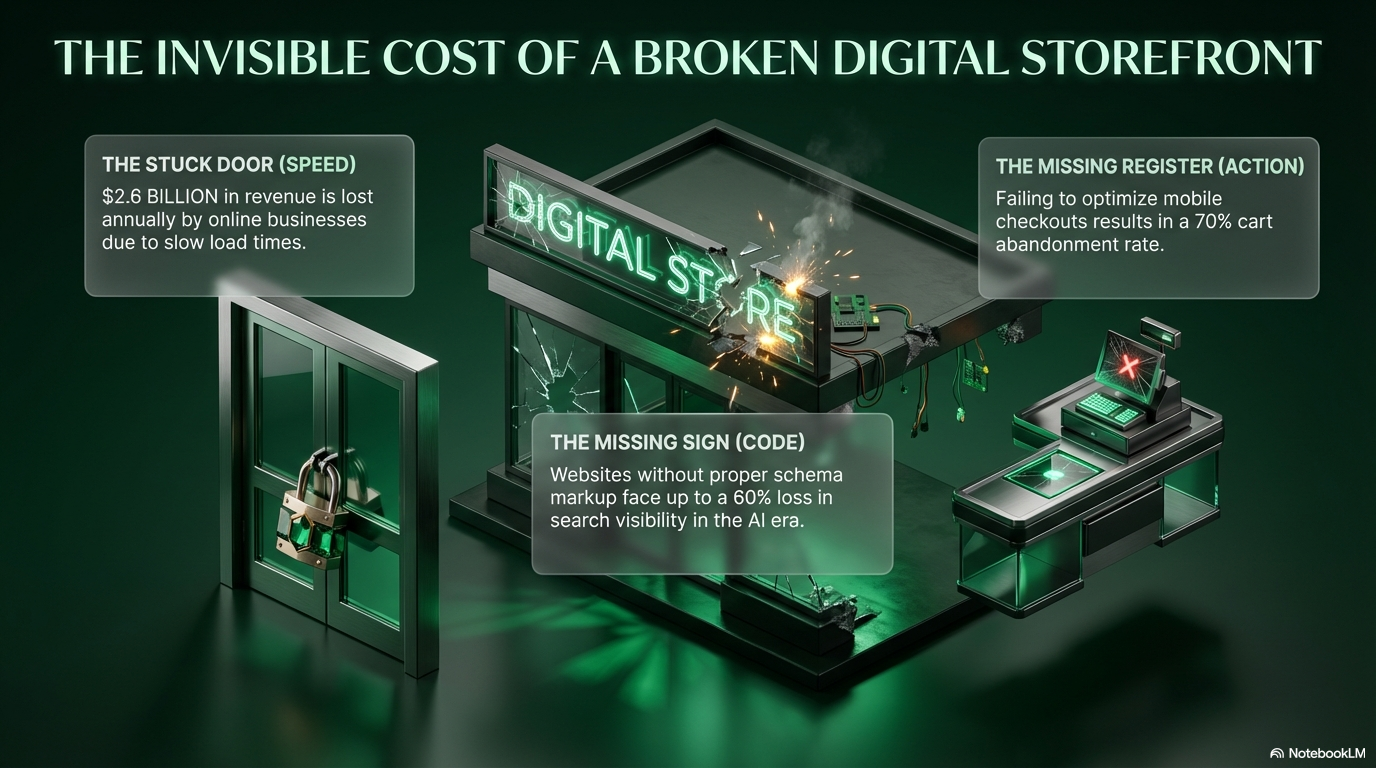
Three broken things are silently killing your revenue:
The Stuck Door (Speed): $2.6 billion in revenue is lost annually by online businesses due to slow load times.
The Missing Sign (Code): Websites without proper schema markup face up to a 60% loss in search visibility in the AI era.
The Missing Register (Action): Failing to optimize mobile checkouts results in a 70% cart abandonment rate.
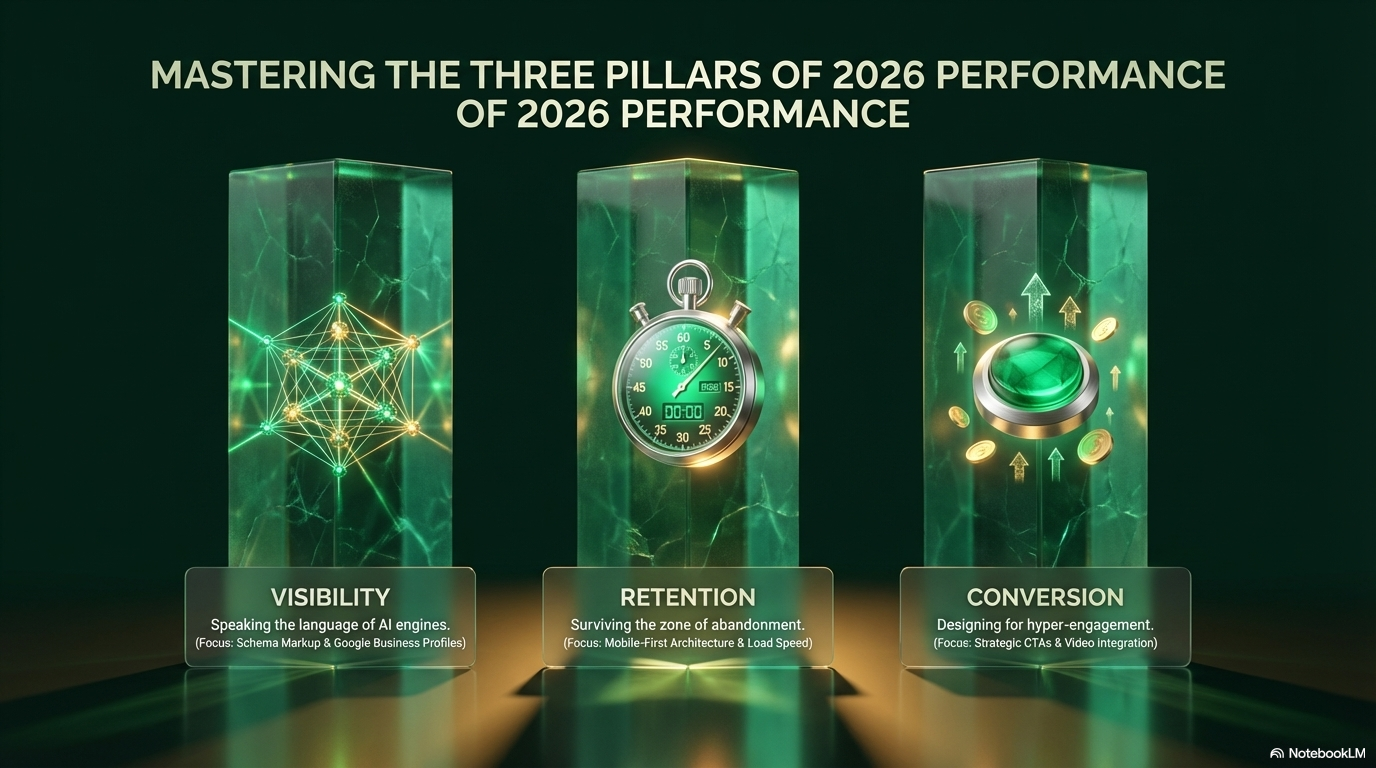
Pillar 1: Visibility — Speaking the language of AI engines. Focus: Schema Markup & Google Business Profile.
Pillar 2: Retention — Surviving the zone of abandonment. Focus: Mobile-First Architecture & Load Speed.
Pillar 3: Conversion — Designing for hyper-engagement. Focus: Strategic CTAs & Video Integration.
Fix one and you get linear growth. Synchronize all three and you get exponential growth.
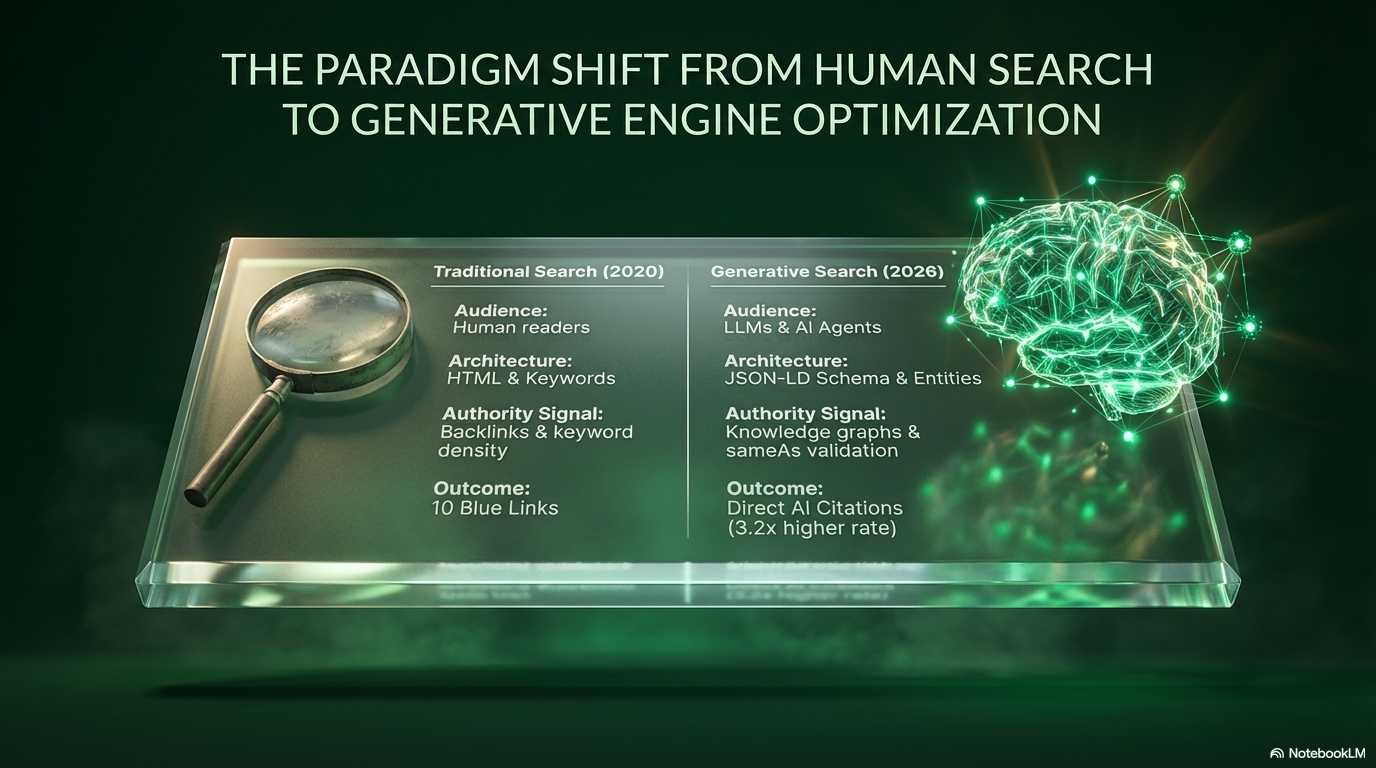
Traditional Search (2020): Audience was human readers. Architecture was HTML & keywords. Authority came from backlinks. Outcome: 10 blue links.
Generative Search (2026): Audience is LLMs & AI agents. Architecture is JSON-LD Schema & Entities. Authority comes from knowledge graphs. Outcome: direct AI citations at 3.2x higher conversion rate.
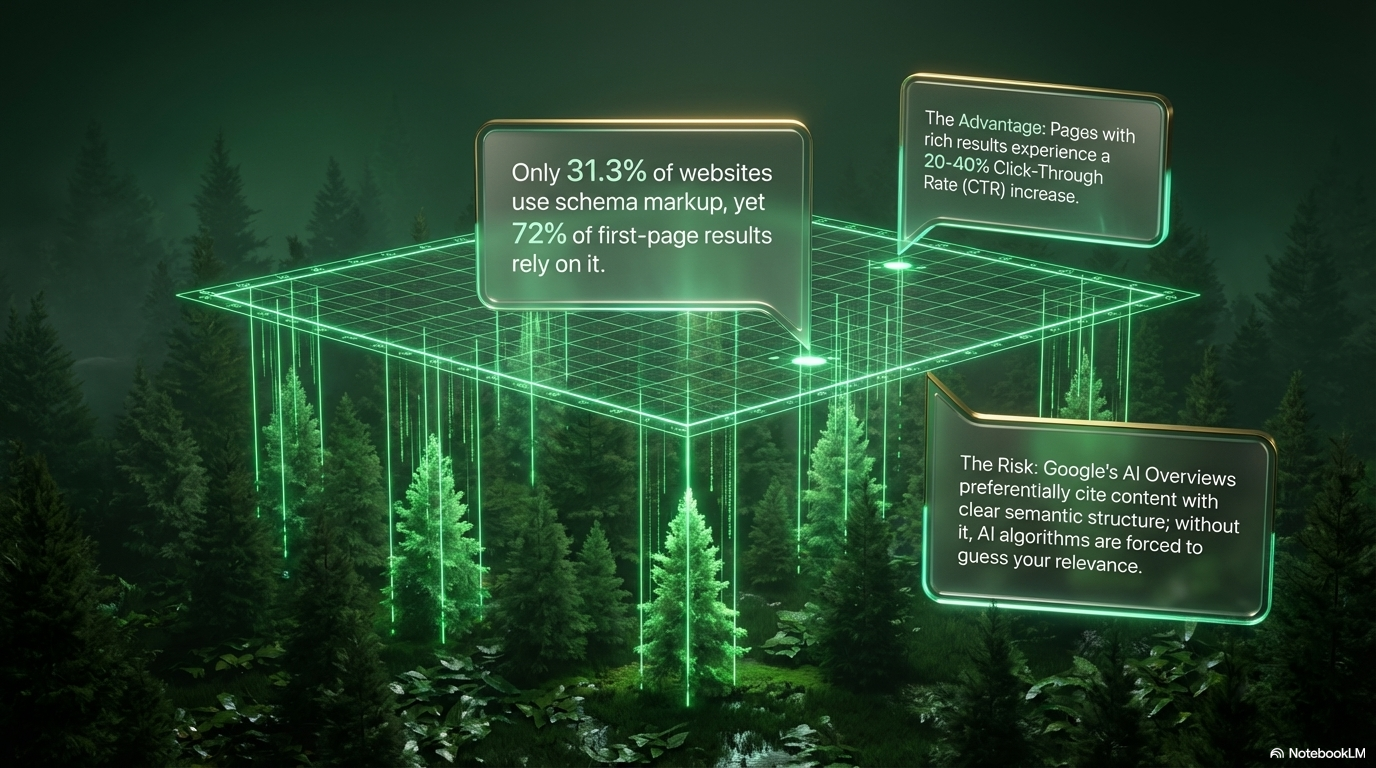
Only 31.3% of websites use schema markup, yet 72% of first-page results rely on it.
Pages with rich results experience a 20–40% Click-Through Rate increase.
The risk: Google's AI Overviews preferentially cite content with clear semantic structure. Without it, AI algorithms are forced to guess your relevance — and they usually guess wrong.
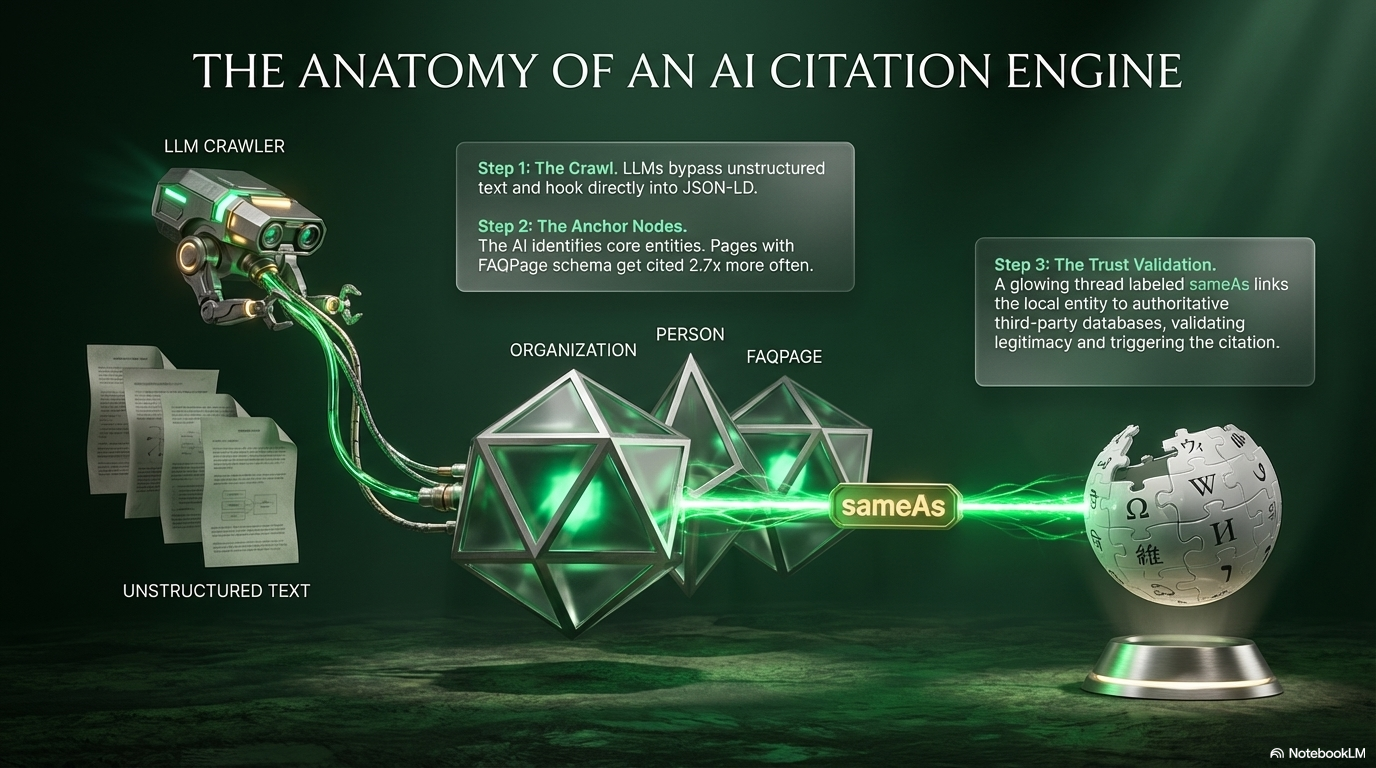
Step 1: The Crawl. LLMs bypass unstructured text and hook directly into JSON-LD schema.
Step 2: The Anchor Nodes. AI identifies core entities. Pages with FAQPage schema get cited 2.7x more often.
Step 3: Trust Validation. A sameAs link connects your local entity to authoritative third-party databases (Wikipedia, LinkedIn), validating legitimacy and triggering the citation.
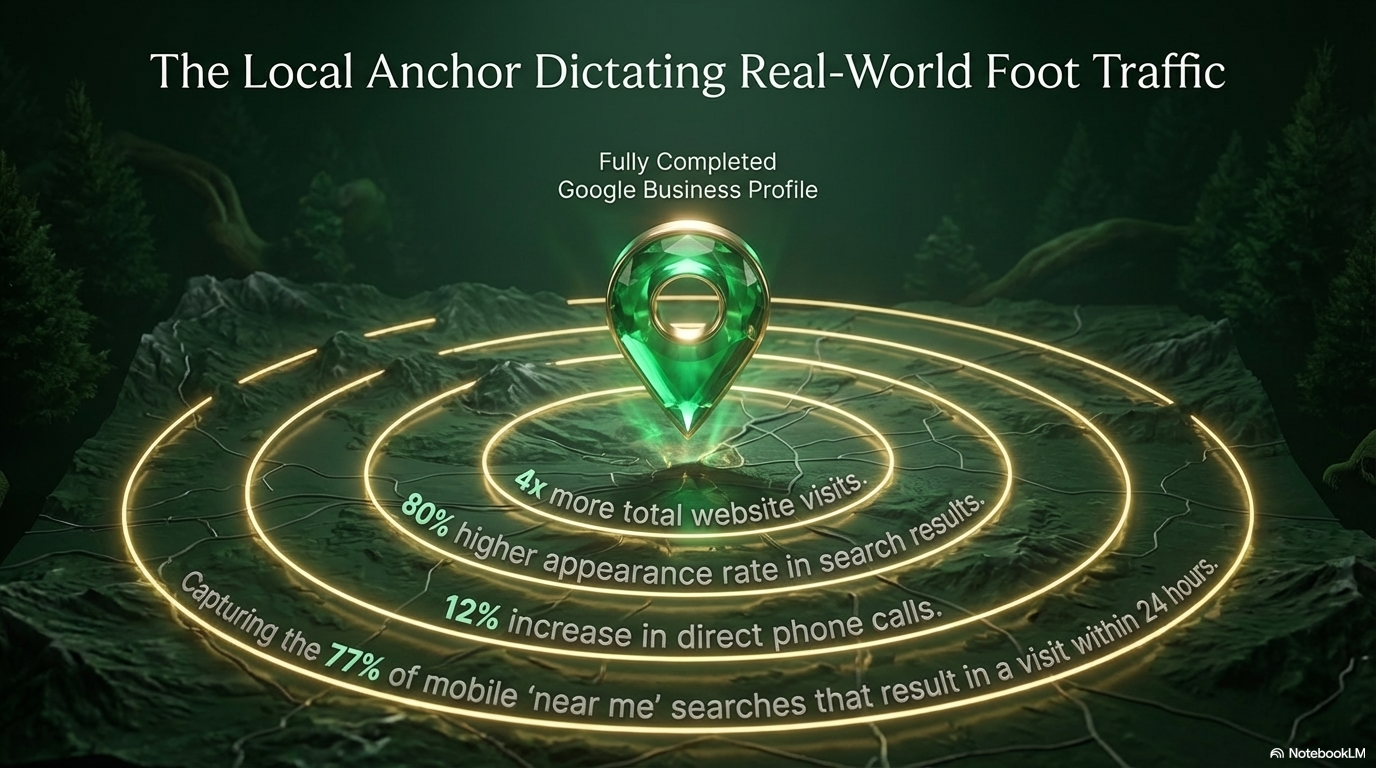
A fully completed Google Business Profile delivers:
4x more total website visits. 80% higher appearance rate in search results. 12% increase in direct phone calls.
It captures 77% of mobile "near me" searches that result in a visit within 24 hours.
If you're a local business and your GBP is incomplete, you're leaving the front door locked.
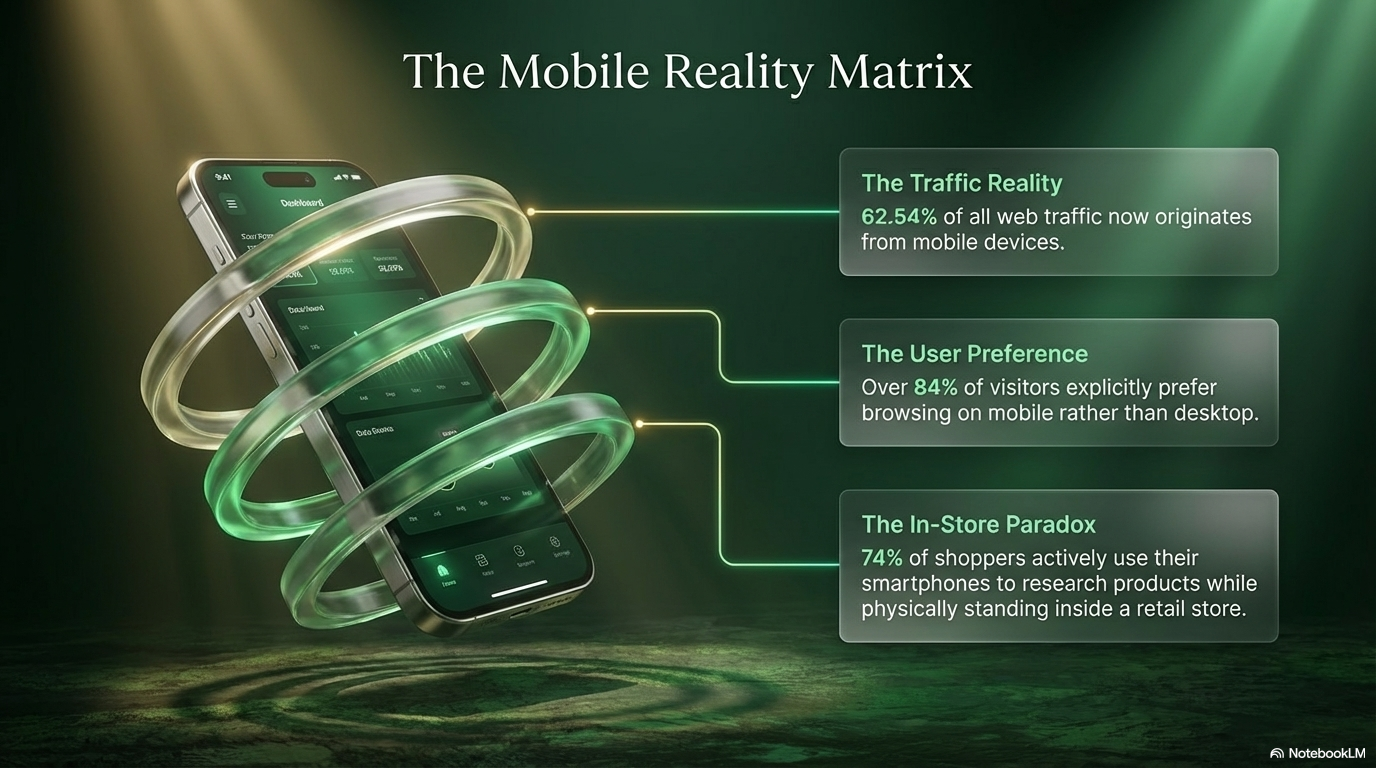
62.54% of all web traffic now comes from mobile devices. Over 84% of visitors explicitly prefer mobile browsing.
The In-Store Paradox: 74% of shoppers use their smartphones to research products while physically standing inside a retail store.
If your site isn't built mobile-first, you're designing for the minority.
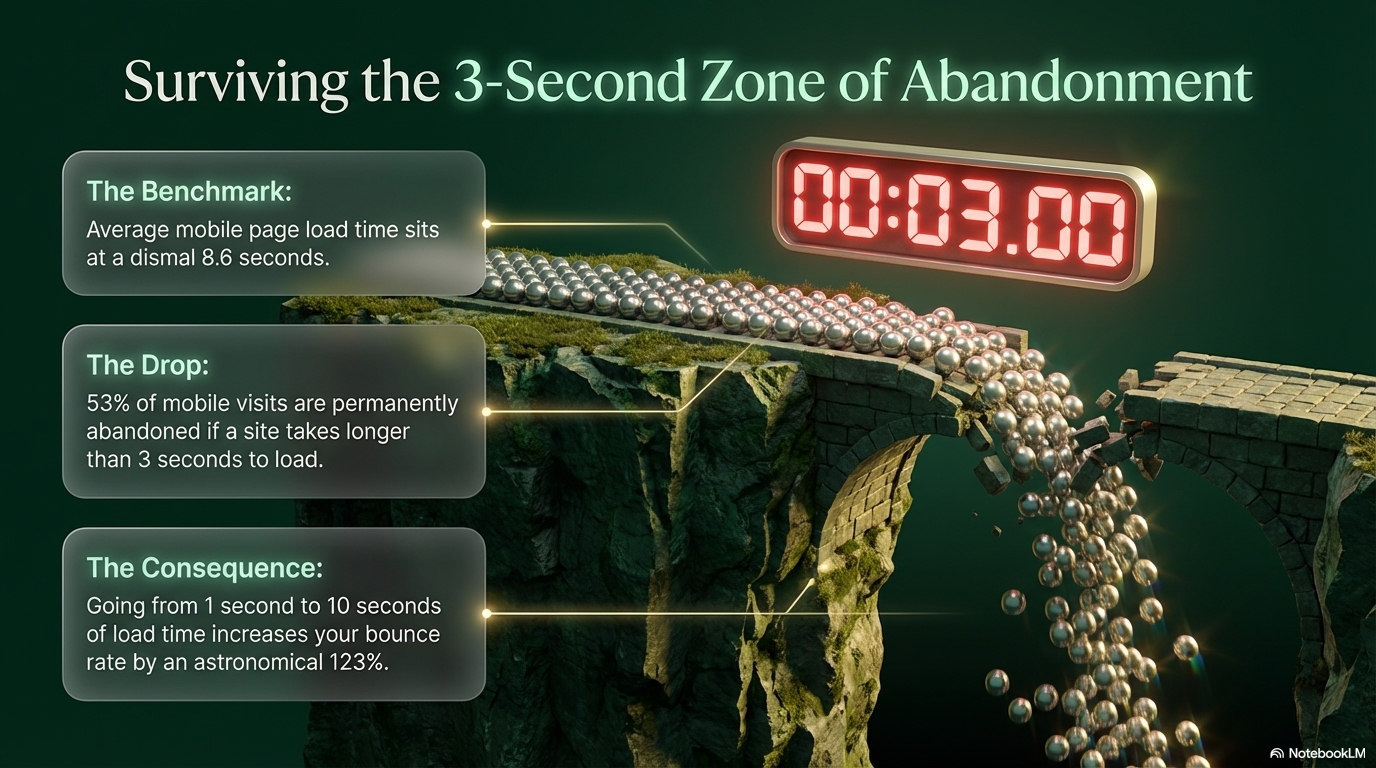
The average mobile page load time is a dismal 8.6 seconds. But 53% of mobile visits are permanently abandoned if a site takes longer than 3 seconds to load.
Going from 1 second to 10 seconds increases your bounce rate by 123%.
Every second counts. Literally.
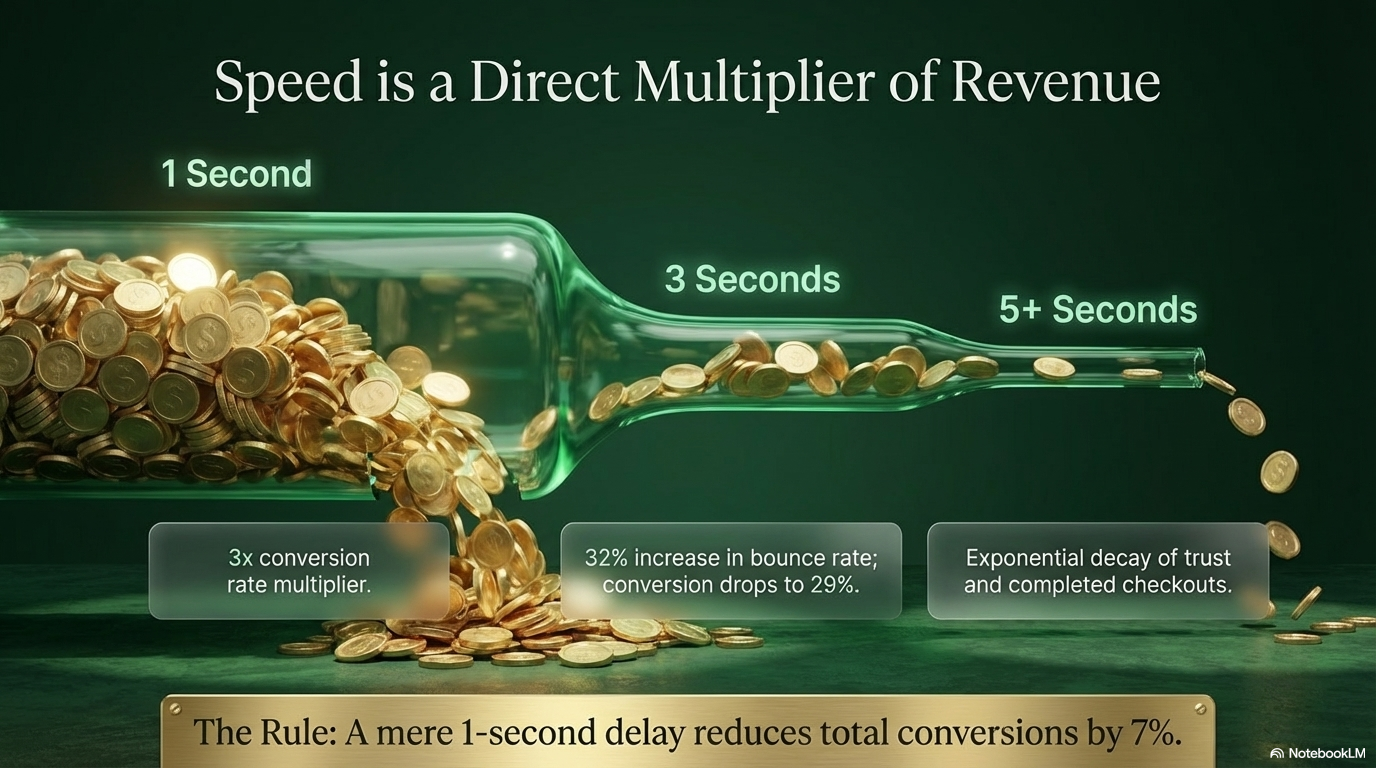
1 Second: 3x conversion rate multiplier. This is the gold standard.
3 Seconds: 32% increase in bounce rate; conversion drops to 29%.
5+ Seconds: Exponential decay of trust and completed checkouts.
The Rule: A mere 1-second delay reduces total conversions by 7%.
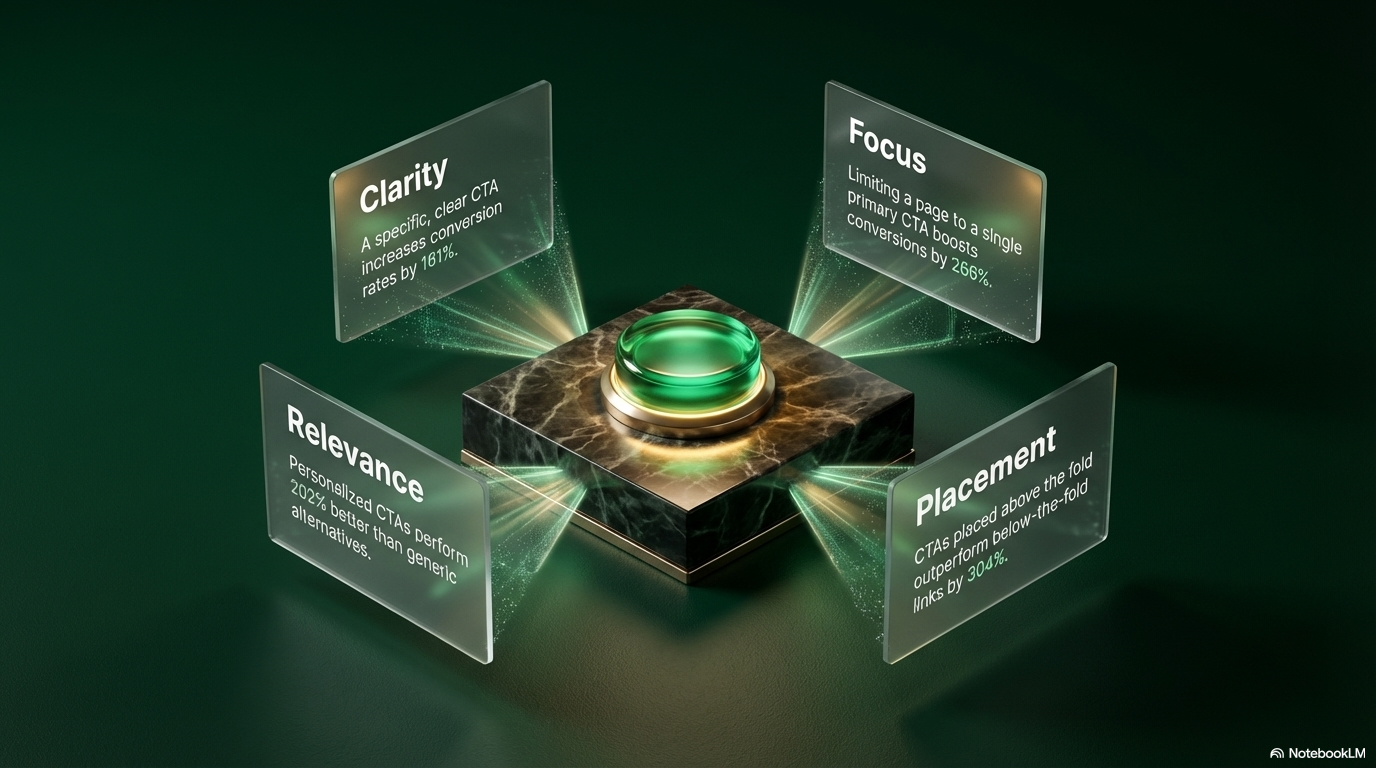
Clarity: A specific, clear CTA increases conversion rates by 161%.
Focus: Limiting a page to a single primary CTA boosts conversion by 266%.
Relevance: Personalized CTAs perform 202% better than generic alternatives.
Placement: CTAs placed above the fold outperform below-the-fold links by 304%.
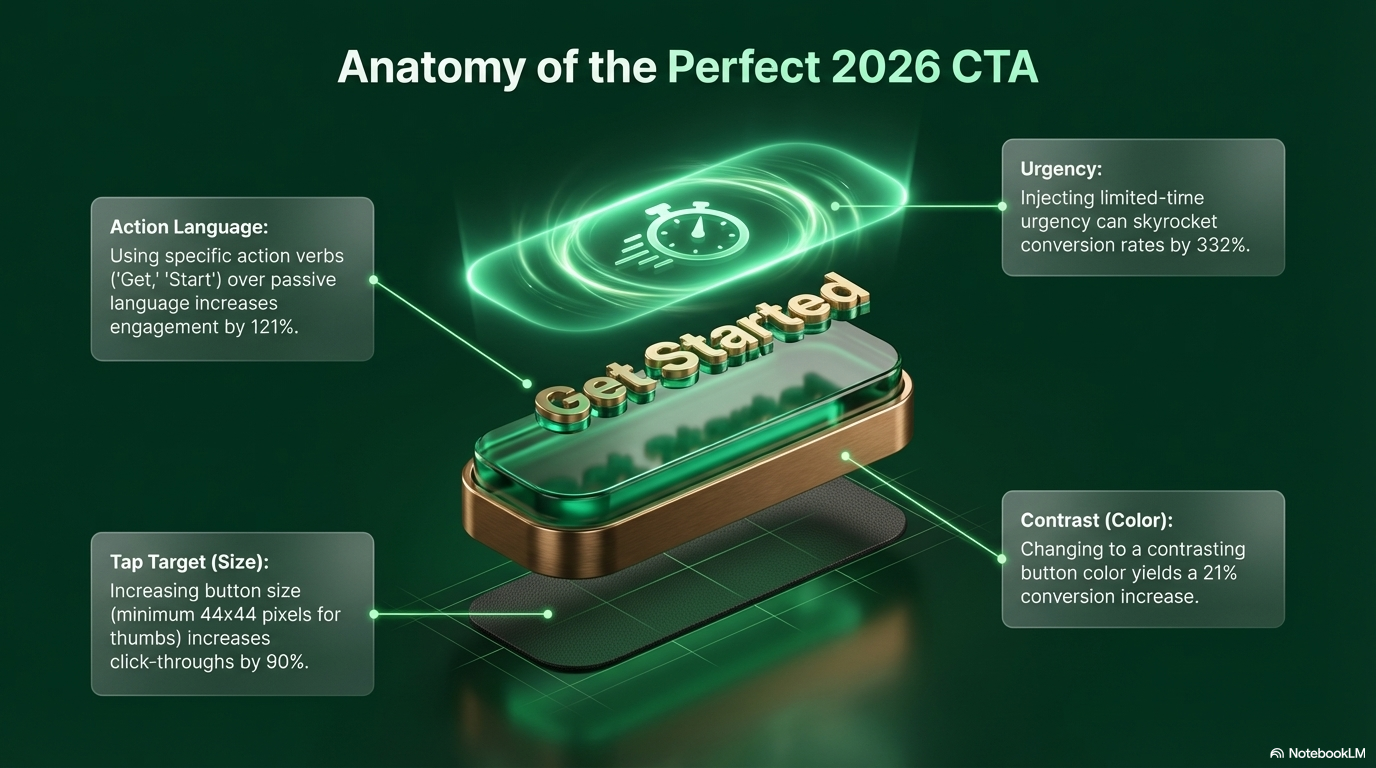
Action Language: Using "Get" or "Start" over passive words increases engagement by 121%.
Urgency: Limited-time language can skyrocket conversion rates by 332%.
Contrast (Color): A contrasting button color yields a 21% conversion increase.
Tap Target (Size): Minimum 44x44 pixels for thumbs increases click-throughs by 90%.
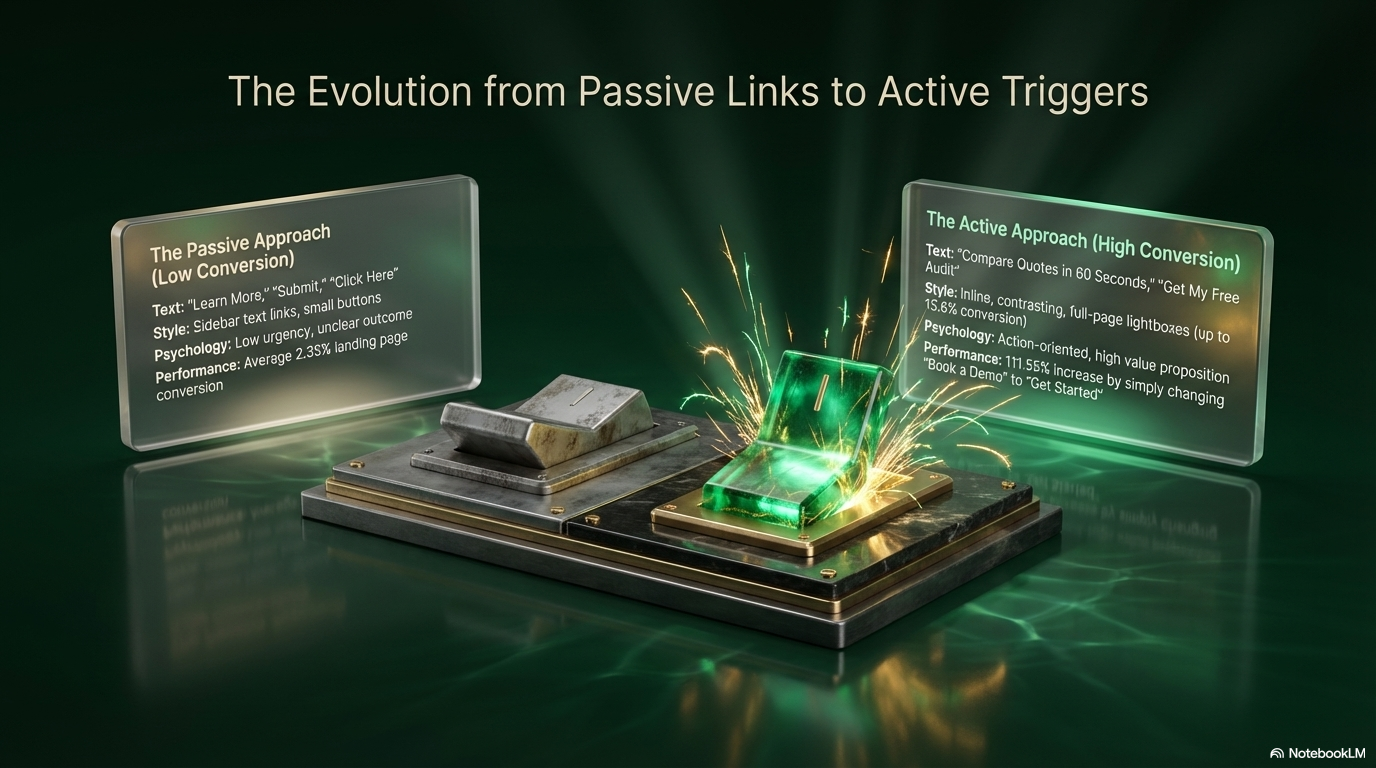
The Passive Approach: "Learn More." "Submit." "Click Here." Small buttons, low urgency, vague outcome. Average: 2.35% conversion.
The Active Approach: "Compare Quotes in 60 Seconds." "Get My Free Audit." Inline, contrasting, full-page lightboxes. Action-oriented, high value proposition.
Simply changing "Submit" to "Get Started" can increase conversions by 111.55%.
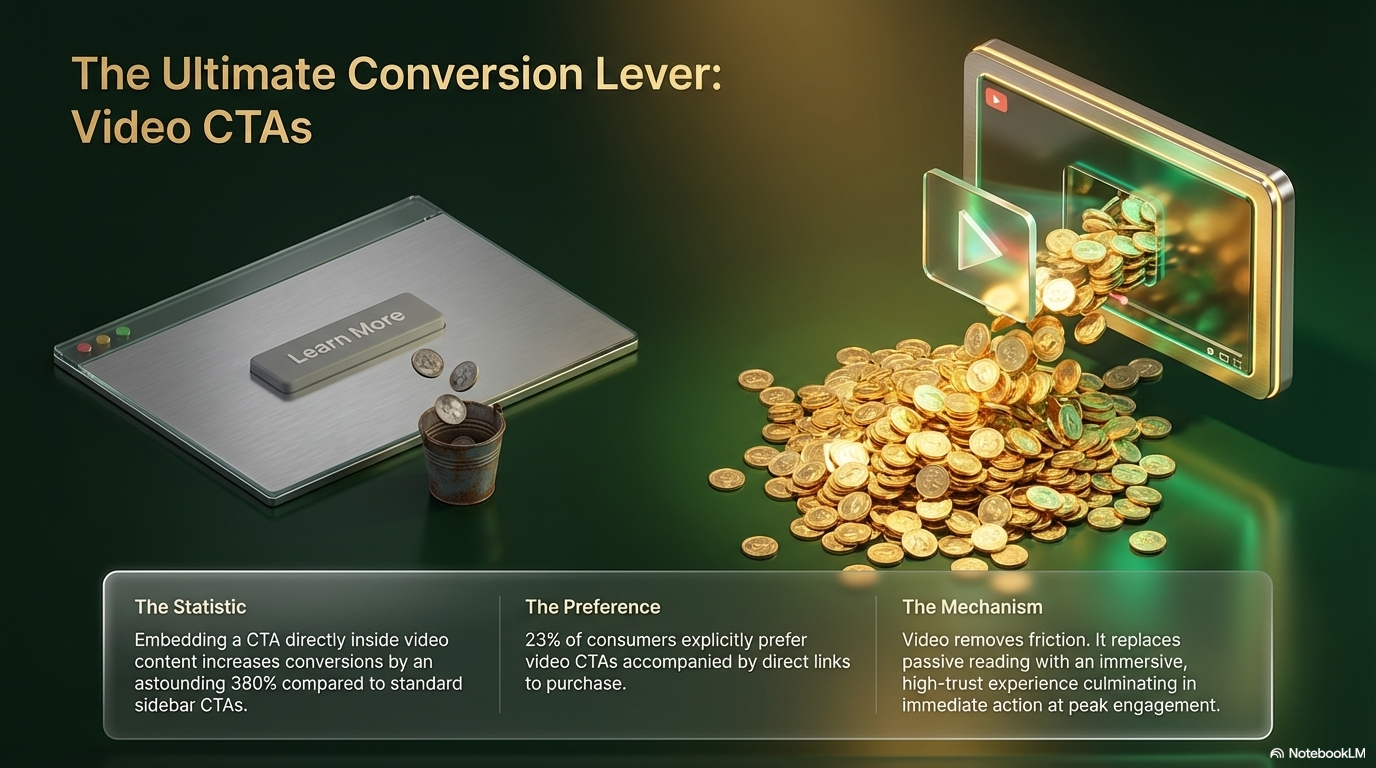
Embedding a CTA directly inside video content increases conversions by 380% compared to standard sidebar CTAs.
23% of consumers explicitly prefer video CTAs accompanied by direct links to purchase.
Video removes friction. It replaces passive reading with an immersive, high-trust experience that leads to immediate action at peak engagement.
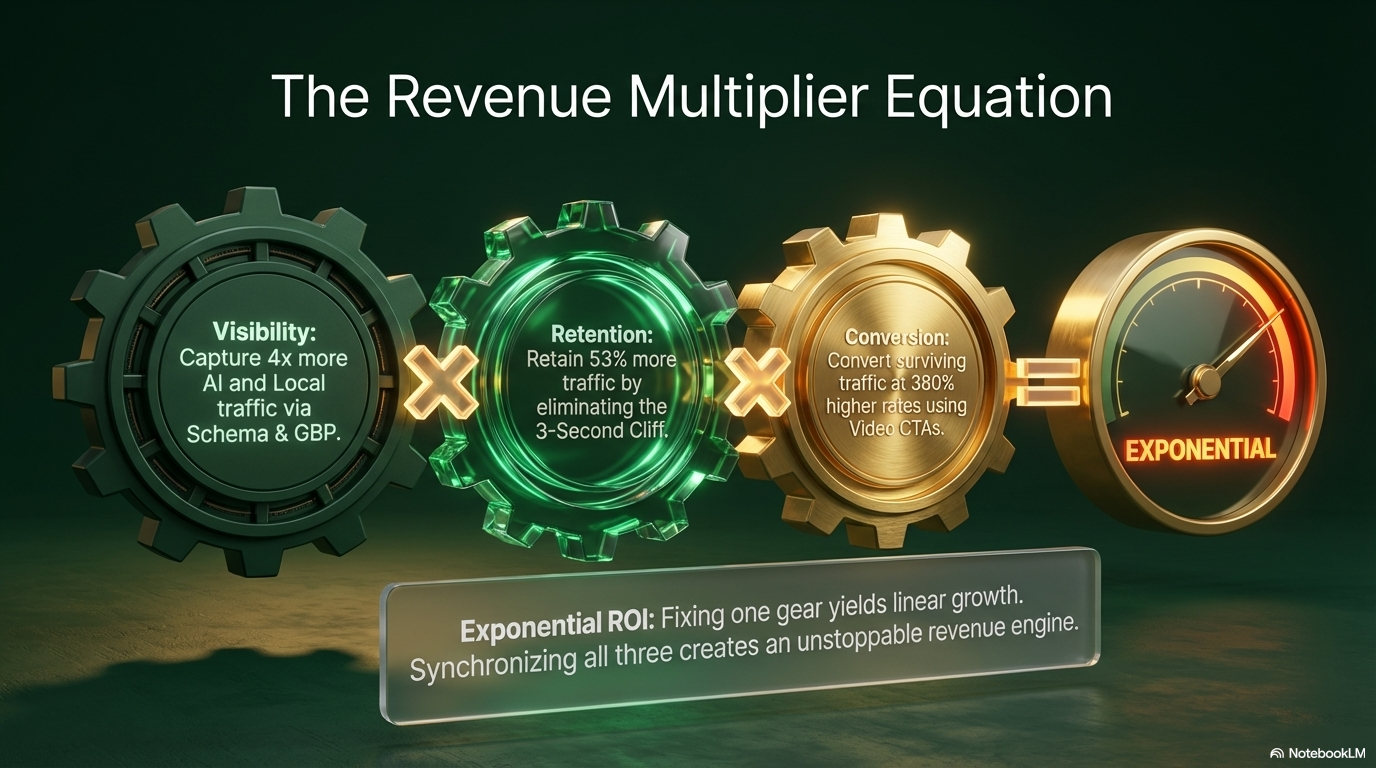
Visibility (capture 4x more AI and local traffic via Schema & GBP) × Retention (retain 53% more traffic by eliminating the 3-second cliff) × Conversion (convert surviving traffic at 380% higher rates using video CTAs) = Exponential ROI.
Fixing one gear yields linear growth. Synchronizing all three creates an unstoppable revenue engine.
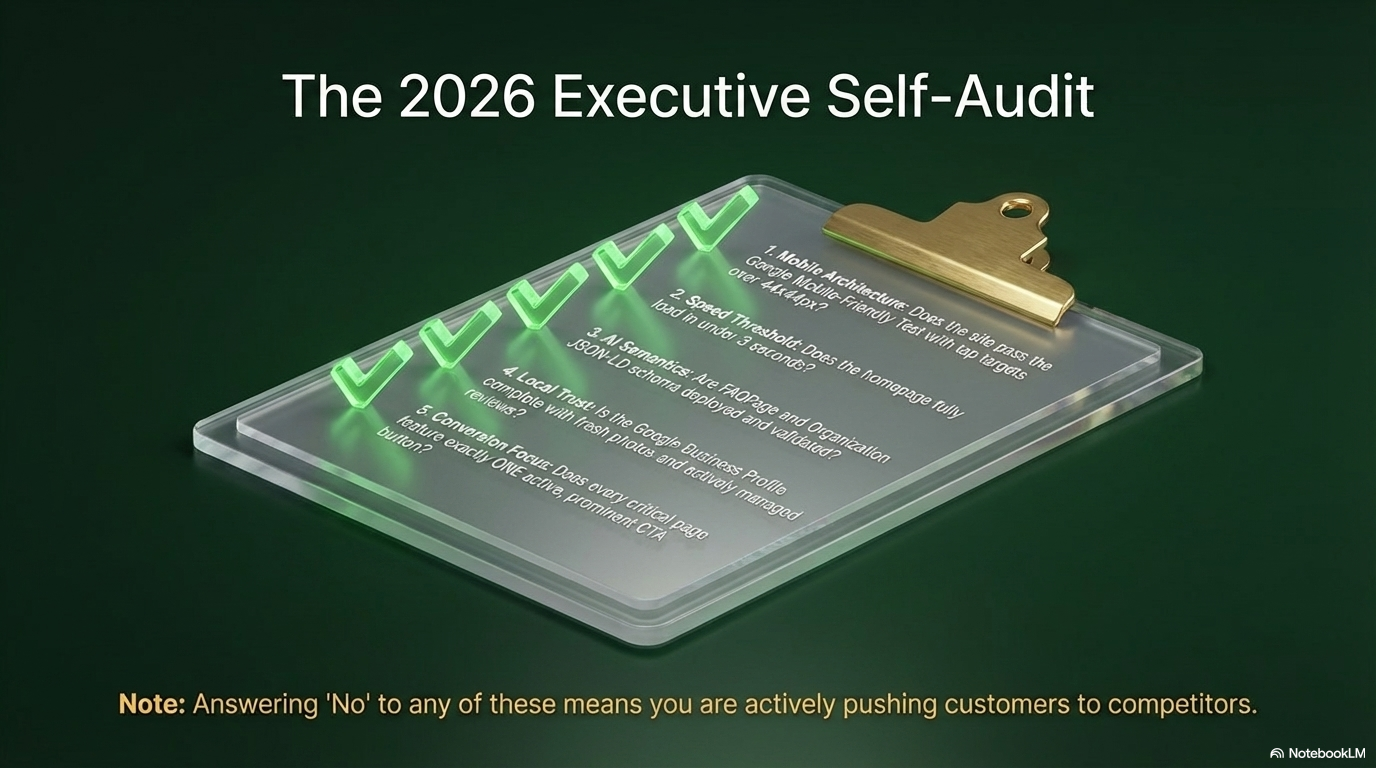
Answer these five questions honestly:
1. Mobile Architecture: Does the site pass Google's mobile-first test?
2. Speed Threshold: Does the homepage load in under 3 seconds on mobile?
3. AI Readiness: Are FAQPage and Organization schema implemented?
4. Local Trust: Is the Google Business Profile 100% complete?
5. Conversion Engine: Does every page have an action-oriented CTA?
Answering "No" to any of these means you are actively pushing customers to competitors.
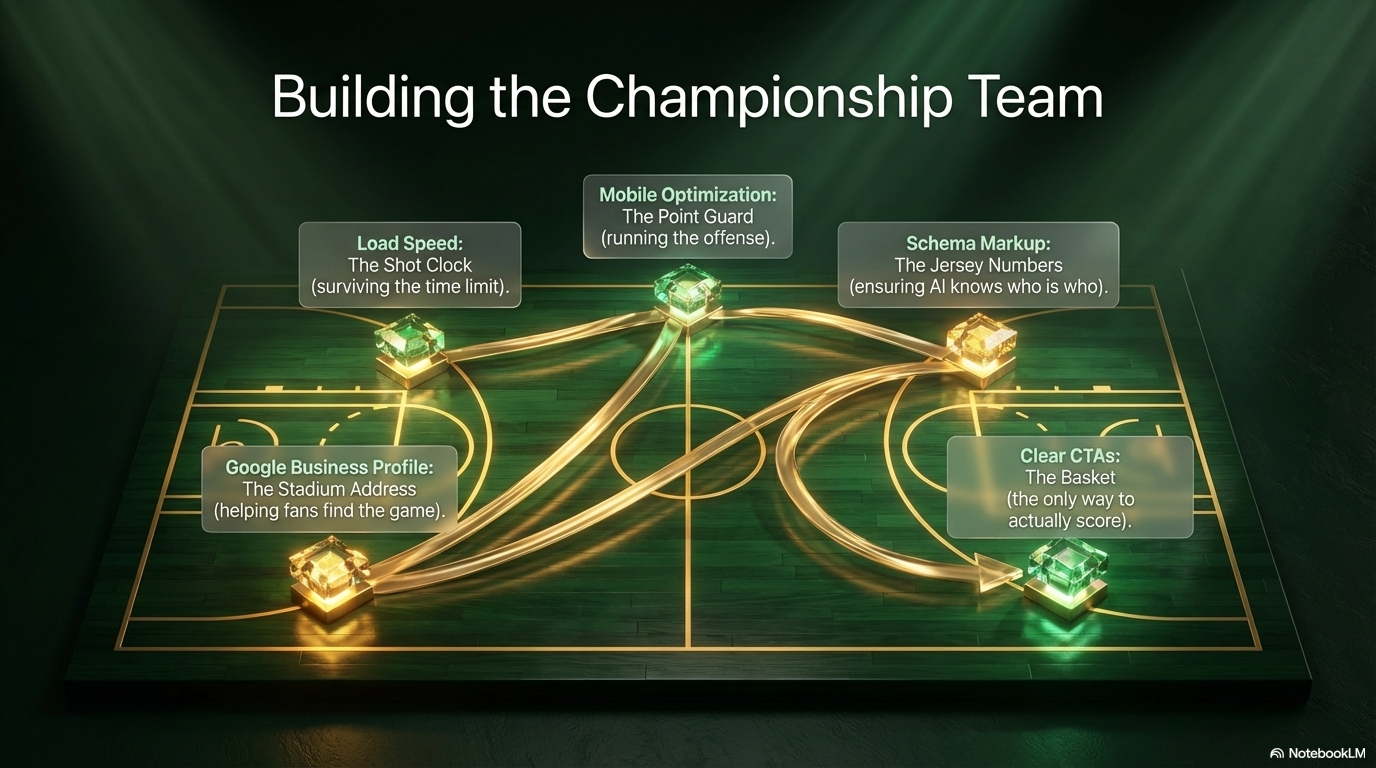
Think of your website as a basketball team. Every position matters:
Load Speed = The Shot Clock (surviving the time limit)
Mobile Optimization = The Point Guard (running the offense)
Schema Markup = The Jersey Numbers (ensuring AI knows who is who)
Google Business Profile = The Stadium Address (helping fans find the game)
Clear CTAs = The Basket (the only way to actually score)
You can't win with just a point guard. You need the whole team.
Get Your Website's Performance Score
You've learned the playbook. Now find out where your business stands — free website audit across all 6 categories.
Get My Free Audit